How Do Computers See Art? –
Throughout my research journey, I focussed a lot on how humans perceive AI generated art. On the whole there was quite an amount of negative bias towards it. Further research revealed that some of this negativity could be mitigated by carefully crafting a narrative to accompany the AI art.
However, this led me to question how do computers actually see and understand the art that they are fed?
I did some further research and I stumbled upon something called ‘pixel data’. This is the raw data the computer uses to display both the colour and brightness of any given pixel on a screen. I wanted to learn more about pixel data.
While doing some research I stumbled across a really interesting website called ‘Think Maths’. On this website was an interesting piece of software to enable the extraction of pixel data called the ‘Spreadsheet Pixel Converter.
After watching one of Matt Parker’s videos on the website, I became completely ‘sold’ on the idea of pixel data and how a computer might at some level actually view or ‘see’ the imagery that is input into a machine learning system. In his video, Matt demonstrated how an image can be seen in its raw state showing its pixel data by looking at an image through a microscope. Interestingly, when I quizzed ChatGPT about this, it suggested that this was not possible. I do intend to find out at some point, but currently I don’t own a microscope. However, in the meantime I decided to try the ‘Spreadsheet Pixel Converter’. It certainly did not disappoint! Sure enough it converted one of my images into raw pixel data and put it into a spreadsheet format.
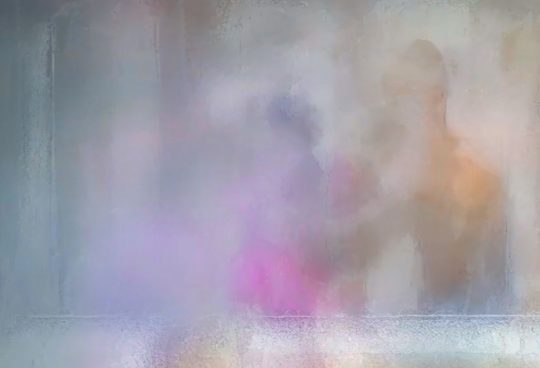
Original Image

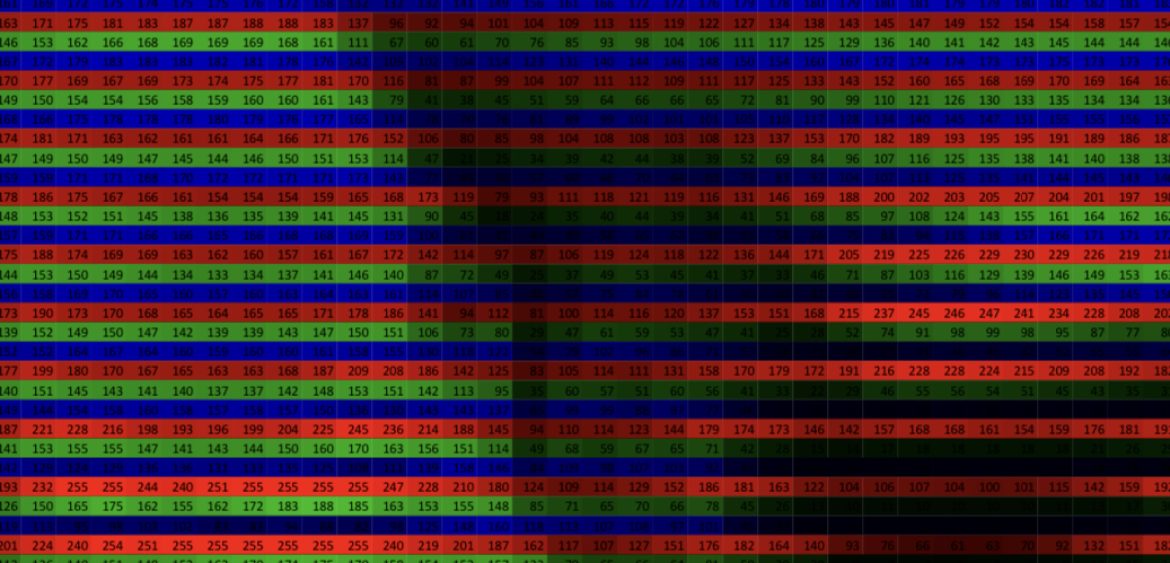
Small Snapshot of Pixel Data
Although I have a full spreadsheet of the image it is too large to display here. Therefore, below is a small portion of the image above in its raw pixel data format.

I found the concept absolutely fascinating! The idea of being able to zoom in on an image so far that the pixel data was visible seemed amazing! This is effectively how a computer makes ‘sense’ of an image.
At this point I wondered if it was possible to make the pixel data more visually appealing? In order to explore the idea of how computers see human art in the context of AI generated art, then pixel data needed to be in there somewhere.
My train of thought led me down a typographical path. Could the pixel data be displayed in a more visually pleasing manner? Could it be displayed in a way that retained the integrity of the data but looked less like pixelated art?
I continued to research and I finally found what I felt was an interesting typographical solution. Below is a word cloud created using a word cloud generator. The generator sorts all characters into a table of their frequencies in descending order. The resulting visual output works on the premise of the greater the frequency of a word or number the larger the character appears in the word cloud. The system works in a similar way to a tag cloud on a website.
I finally felt that my concept was beginning to deepen on both a visual and more meaningful level. Below is a word cloud generation of the pixel data from the image above.
Image Data as a Word Cloud
The image below has been generated from the pixel data of the original image above. The data has been broken down into the frequency of each number. I felt that this was a more visually appealing way to present the data above. Although the data isn’t in its correct place as in the pixel spreadsheet above – it does still represent the frequency and relationship between bright and dark areas of the original image. I wondered what a famous image like the Mona Lisa would look like converted into its pixel data and viewed as a word cloud? This is something that I’d like to try. Indeed, I’d love to know what many of the famous works of art might look like broken down into a word cloud representative of their light values.

While exploring these concepts I also came across another program that could covert an original image into its pixel data and then display it in a variety of different ways. The pixel data could be broken down photographically or into its constituent colours with either a red, green or blue priority.
Below is a small gallery of some of these pixel data experiments.
Visually Represented Sorted Pixel Data
ChatGPT3 Writes Machine Learning Code
While still exploring the idea of word clouds, I decided to ask Chat GPT3 what an actual machine learning program might look like. This was the result:
”Here’s a simple example of Python code using the popular machine learning library, scikit-learn. This example demonstrates a basic linear regression model, which is commonly used for predicting numerical values based on input features.”
The Code
# Import necessary libraries
import numpy as np
from sklearn.model_selection import train_test_split
from sklearn.linear_model import LinearRegression
from sklearn.metrics import mean_squared_error
import matplotlib.pyplot as plt
# Generate random data for demonstration
np.random.seed(42)
X = 2 * np.random.rand(100, 1)
y = 4 + 3 * X + np.random.randn(100, 1)
# Split the data into training and testing sets
X_train, X_test, y_train, y_test = train_test_split(X, y, test_size=0.2, random_state=42)
# Create and train the linear regression model
model = LinearRegression()
model.fit(X_train, y_train)
# Make predictions on the test set
y_pred = model.predict(X_test)
# Evaluate the model
mse = mean_squared_error(y_test, y_pred)
print(f”Mean Squared Error: {mse}”)
# Visualize the results
plt.scatter(X_test, y_test, color=’black’, label=’Actual’)
plt.plot(X_test, y_pred, color=’blue’, linewidth=3, label=’Predicted’)
plt.xlabel(‘Input Feature’)
plt.ylabel(‘Target Variable’)
plt.title(‘Linear Regression Example’)
plt.legend()
plt.show()
The Code Word Cloud
The program above, while it might be used as a training model, is not particularly appealing. Therefore, I decided to try yet another word cloud, only this time using the text from the machine learning program. I found the results to be visually quite appealing. Of course the word count is a visual representation of the frequency of words. It creates an appealing pattern and pattern recognition is exactly how machine learning algorithms work.

Binary Code
Of course no investigation into algorithmic image perception would be complete without exploring binary code. As part of my overall project, I asked ChatGPT3 to generate a short 3 word sentence into binary code. Please see below for the result. I’m not going to reveal yet what it says but it could form an integral part of my project going forward.
01010101 01101110 01101001 01110100 01111001 00100000 01101001 01101110 00100000 01000010 01101001 01110100 01110100 01110011
Conclusion
Raw data in the form of numbers, binary code and patterns are the staple diet of computers, algorithms and machine learning programs. Using a variety of methods this data can be worked into more visually appealing, yet still meaningful imagery. This blog explores an alternative viewpoint. It looks at images from the perspective of a computer or a machine. This is in contrast to the perception of an AI image by a human.
As a direct result of these investigations I have decided to start making a mobile based on the binary code above.